The discovery half of the Lattice Suite. Visualise how price interacts with order networks across decades of data in seconds. Find your edge, shape your parameters, then transfer them directly to Lattice Command™ for backtesting, refinement, and live deployment.
Lattice Vision™ is analytical software developed by Cave and Fire Group Pty Ltd. No trades are placed. No signals are issued. It does not provide financial advice or guarantee any outcome.
Software Disclosure: Cave & Fire Lab is a trading name of Cave and Fire Group Pty Ltd., a software development company. We are not a financial services provider, broker, fund manager, or advisory firm. We do not provide financial advice, trading signals, or recommendations of any kind. Lattice Vision™ is a visualisation and analysis tool. It does not place trades or generate signals. All analytical results are for informational purposes only.
Lattice Vision is the discovery and analysis half of the Lattice Suite. It provides a structured, non-executing environment for observing how price interacts with configurable order networks across any amount of historical data — enabling you to evaluate exposure, behaviour, and outcomes before deploying a single dollar.
Instead of waiting hours for backtests or squinting at tiny chart windows, you get a bird's-eye view of how your parameters behave across different market conditions — years of data rendered instantly on a single screen. Adjust a distance, change a lot size, toggle a mode, and watch the impact ripple across the entire dataset in real time. This visual approach helps you build genuine intuition for your configuration instead of blindly trusting a single metric.
The purpose is straightforward: find settings that work, then transfer them directly to Lattice Command™ for proper backtesting with its advanced trigger options, and ultimately live deployment. Both tools share identical core logic — lattice construction, Ghosting Technology™, distance modes, and parameter structure — so what you see in Vision is exactly what you get in Command.
Every parameter, every rule, every piece of logic is exposed and explained. There's an integrated metric guide that clarifies what each measurement means, why it matters, and what typical acceptable ranges look like. No black box. No mystery. No guesswork.
One of the most powerful innovations in the Lattice Suite is Ghosting Technology™ — a proprietary trigger-filtering system that fundamentally changes how order networks behave.
Here's the problem it solves: when price first enters a lattice, the initial interactions are often noise — premature triggers during unstable conditions before the market has committed to a direction. Traditional networked-order systems execute on every crossing indiscriminately. That early exposure can drag the entire basket into an unfavourable position before the real move even begins.
Ghosting Technology™ lets you define how many initial interactions are observed but not executed. These "ghost" triggers are tracked and displayed on the chart as distinct markers, but no simulated position is created. Only after the ghost threshold is reached do subsequent interactions become active. The result is a configurable positioning phase that filters out noise and lets your network engage when price has demonstrated real commitment.
This isn't a simple delay — it's an intelligent filter. Ghosted interactions still count toward the basket lifecycle, they're still visible on the chart, and the ghost count is fully adjustable in real time. You can experiment with different values and instantly see how each ghost count changes the outcome profile across your entire study range.
Critically, the ghosting logic is identical between Lattice Vision and Lattice Command. The ghost count you discover works best in Vision will produce the same filtering behaviour when deployed live in Command. No surprises. No discrepancy. One system, two environments.
Ghosting Technology™ in action — ghost triggers tracked and visualised on chart before any position is created
Lattice Vision and Lattice Command aren't just compatible — they're two halves of a single system. They share the same underlying engine: identical lattice construction, identical Ghosting Technology™, identical distance modes, and identical parameter definitions. Settings transfer directly between them with complete fidelity.
Rapidly explore configurations across historical data. Adjust distances, lot sizes, ghost counts, targets, and distance modes. Observe basket behaviour, drawdown characteristics, and outcome patterns across years of data in real time. Save promising configurations to presets for comparison. Export results to CSV for further analysis.
Transfer your discovered settings directly to Lattice Command. Run proper tick-by-tick backtests in the MetaTrader 5 strategy tester with Command's full execution engine — including its advanced trigger options like consolidated execution, recross confirmation, direction inversion, and Ghosting Technology™ that go beyond Vision's visual simulation into real order management.
Deploy with Command's hardened execution architecture — persistent state recovery, multi-layer risk safeguards, adaptive broker compatibility, instant parallel close, and 24/7 VPS reliability. The same parameters, the same ghosting logic, the same behaviour — now executing real orders with production-grade resilience.
This separation is deliberate. Vision gives you speed and visual clarity for exploration — scan decades of data in seconds, test hundreds of configurations in an afternoon. Command gives you execution hardening and advanced trigger mechanics for real deployment. Together they form a complete pipeline from idea to live operation, with no translation layer and no configuration mismatch.
Up to 20 price interaction levels — 10 upper (sell) and 10 lower (buy). Every level has independent spacing and independent lot sizing. Build uniform lattice shapes, progressive structures, asymmetric layouts, or any custom configuration you can imagine. The full structure transfers directly to Lattice Command™ with zero translation.
PIPS Mode: Fixed pip-based spacing. Constant distances regardless of market conditions — ideal for instruments with stable volatility profiles. ATR Mode: Adaptive spacing using Average True Range over a configurable lookback period. Distances automatically expand when volatility rises and contract when it falls — keeping your lattice proportional to actual market movement. Toggle between modes instantly to compare behaviour across the same data range. Both modes are shared identically with Lattice Command™.
The order network automatically recentres on the SMA reference at configurable intervals measured in bars. This keeps the lattice aligned with evolving price structure rather than anchored to a stale level from hours or days ago. The recalibration interval is adjustable in real time, and the logic mirrors Lattice Command™ exactly.
Anchor reference calculations to a fixed timeframe — such as M1 — while viewing results on any chart resolution. This means you can zoom out to H1 or H4 for broad context while maintaining the precision of lower-timeframe SMA calculations. Essential for reviewing years of data without sacrificing accuracy.
Reverse the execution direction with a single toggle. Upper crossings become buy signals, lower crossings become sell signals. Instantly see how a contrarian approach performs across the same data range and lattice structure. The same inversion option is available in Lattice Command™.
ATR distance mode — lattice spacing adapts dynamically to market volatility
A comprehensive analytics panel that updates instantly as you adjust any parameter. Displays: net PnL, win/loss count, win rate, maximum drawdown, peak exposure, expectancy, return-to-drawdown ratio, Sharpe ratio, maximum consecutive losses, and longest basket duration. All values normalised to account currency with colour-coded risk encoding — green for acceptable, amber for cautionary, red for elevated. Every number recalculates the moment you change anything.
Shows exactly how many pips the current simulated basket needs to move to reach the target threshold, along with the precise target price level. Gives you an intuitive, real-time feel for how close or far each cycle is from completion at any point in the study. Invaluable for understanding the "feel" of a configuration — not just the end results.
Estimated swap costs are calculated and included in basket PnL based on long and short swap rates. This provides significantly more realistic outcome measurements, especially for configurations that hold positions across multiple days or weeks. Without swap modelling, results can paint an overly optimistic picture — Vision doesn't let that happen.
Reference estimates for capital requirements under common leverage conditions — 1:30, 1:100, and 1:500. Calculates the margin required for maximum possible exposure based on your configured lot sizes across all 20 levels, and provides conservative balance buffer estimates based on observed drawdown behaviour. Know before you deploy whether you have enough capital. Informational and non-binding.
Set a spread value to include transaction cost modelling in all measurements. This ensures analytical results account for the real cost of entry and exit. Adjustable in real time — tighten or widen the spread assumption and watch how sensitive your configuration is to transaction costs.
Not sure what expectancy means? Wondering what a good Sharpe ratio looks like? The built-in metric guide explains every measurement in plain language with colour-coded threshold values: what it represents, why it's relevant, how to interpret it, and what typical acceptable ranges look like. Accessible directly from the interface with a single click. Designed for clarity, not academic theory.
Study results — basket outcomes, win rates, drawdown metrics, Sharpe ratio, and exposure analysis at a glance
Built-in metric guide — every measurement explained with colour-coded threshold values
Every completed basket cycle is rendered directly on the chart with colour-coded markers — green for profitable closures, red for losses, with PnL annotations. See at a glance where clusters of success or failure occur, which market regimes produce favourable outcomes, and how behaviour changes across different conditions. This is the "big picture" view that no backtest report can give you.
Ghosted (filtered) interactions are visually distinct from active ones directly on the chart. You can see exactly which price crossings were observed but ignored during the positioning phase, and which resulted in simulated positions. This makes Ghosting Technology™ tangible and intuitive — not just a number in a settings panel.
Upper and lower interaction levels are displayed as colour-coded horizontal lines on the chart, showing you exactly where the order network sits relative to current and historical price action. Buy levels in green, sell levels in red. The lattice updates in real time as parameters change.
Define your analysis window using draggable chart markers. All calculations update immediately as you move them. Extend the range into live price action for forward observation, or narrow it to a specific event. The FIND LINES button snaps markers to your current chart view with a single click.
Draggable study lines — define and adjust your analysis range visually on the chart
Switch your chart to Daily, Weekly, or Monthly timeframe. Watch decades of basket cycles play out across macro price action — see exactly how your lattice shape would have performed through every market regime.
Decades of basket cycles visualised on a monthly chart — 2006 to 2026
Each symbol supports three independently saved configuration profiles. Store your conservative, moderate, and aggressive setups — or any three configurations you want to compare. Save distances, lot sizes, ghost count, target threshold, and distance mode with a single click. Recall and compare instantly. Presets persist across sessions, so your work is never lost.
Export complete study results in CSV format with a single button press. Every basket cycle captured with: study ID, timestamps, total volume, aggregate outcome, maximum adverse movement, and interaction count. Compatible with Excel, Google Sheets, Python, R, or any statistical tool. Files saved to MQL5/Files/ for immediate access.
Save your current working configuration or restore factory defaults at any time. Experiment freely — push parameters to extremes, test radical configurations — knowing you can always snap back to a known-good state with one click.
Dedicated buttons for M1, M5, M15, and H1 allow rapid chart timeframe switching without leaving the interface. Calculations remain anchored to your configured reference timeframe regardless of which chart timeframe you're viewing — so you can zoom out for context without affecting precision.
Clean, professional dark interface inspired by institutional terminals. Structured sections with clear headers and visual dividers. Designed for extended use without eye strain. Everything you need in one cockpit panel — parameters, presets, actions, study results — all accessible without opening dialogs or restarting the tool.
All key parameters are editable directly from on-chart input fields: distances, lot sizes, ghost count, target threshold, spread assumption, reset interval, and SMA period. Change any value and the entire study recalculates instantly across your full data range. No compile cycles. No restart. No waiting. Just immediate visual feedback.
Toggle the entire interface on and off with a single button. When hidden, your chart is completely unobstructed for manual analysis. When shown, every control and metric is immediately accessible. The toggle persists between chart switches.
The full cockpit — parameters, presets and controls all accessible from a single on-chart panel
Test configurations in seconds instead of hours. Adjust distances, lot sizes, ghost counts, and modes and watch outcomes update instantly across years of data. Find promising parameter zones before committing to time-consuming backtests in Command.
Experiment with different Ghosting Technology™ thresholds to find the sweet spot between filtering noise and maintaining enough active interactions. See exactly how each ghost count changes the outcome profile, drawdown characteristics, and win rate across your entire dataset. The same ghost logic carries directly to Command.
Toggle between PIPS and ATR distance modes to compare fixed versus volatility-adaptive spacing across the same market data. Understand which approach suits each instrument before selecting a mode for deployment in Command.
Identify exactly when and where configurations produce maximum adverse movement. Use this to set appropriate safeguard thresholds in Command, or to eliminate instruments and configurations that exceed your risk tolerance.
Nudge individual parameters and watch the impact ripple across the entire dataset. Find the stable zones where small changes don't dramatically alter outcomes — a sign of robust configuration rather than curve-fitting.
Rapidly evaluate the same configuration across multiple symbols. Use presets to store per-symbol optimised settings. Export CSV results for cross-instrument comparison in spreadsheets.
Before transferring settings to Lattice Command™, use Vision to thoroughly understand the behaviour — the drawdown profile, the win rate, the exposure characteristics, the margin requirements. Deploy informed, not hopeful.
Review maximum drawdown, peak margin usage, and capital requirements against funded-account constraints. Use the margin guide to verify your configuration stays within evaluation limits before risking a challenge fee.
Available exclusively on the official MQL5 Marketplace by MetaQuotes. Your purchase is protected by MetaQuotes' secure licensing system, with verified seller registration and automated product testing.
One-time purchase • Free updates • Intro price ends March 31, 2026
Why the MQL5 Marketplace?
All Cave & Fire Lab products are distributed exclusively through the official MQL5 Marketplace operated by MetaQuotes. This means secure payment processing, hardware-bound licensing that protects your purchase, verified seller identity, and every product version passes automated quality checks before publication. It's the safest way to buy MT5 software.
For the complete workflow, pair with Lattice Command™ — the execution half of the Lattice Suite.
Lattice Vision™ is a software product developed and published by Cave and Fire Group Pty Ltd., a registered Australian company operating under the trading name Cave & Fire Lab. Cave and Fire Group Pty Ltd. is a software development company. We are not a financial services provider, broker, dealer, fund manager, investment adviser, or holder of an Australian Financial Services Licence (AFSL). We do not operate in the financial services industry. We make software.
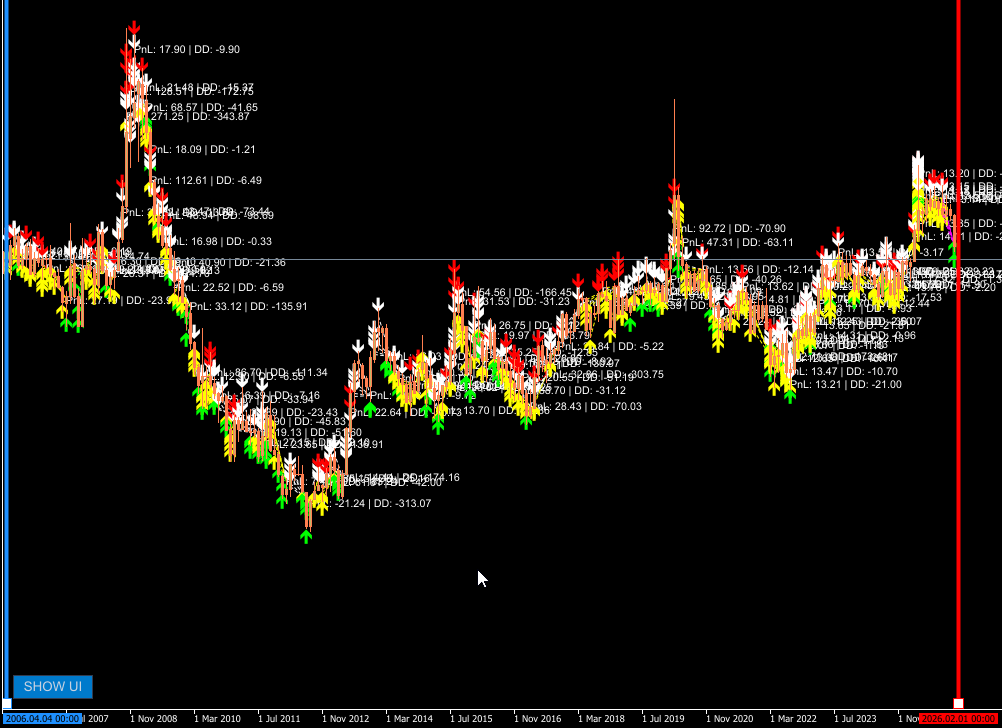
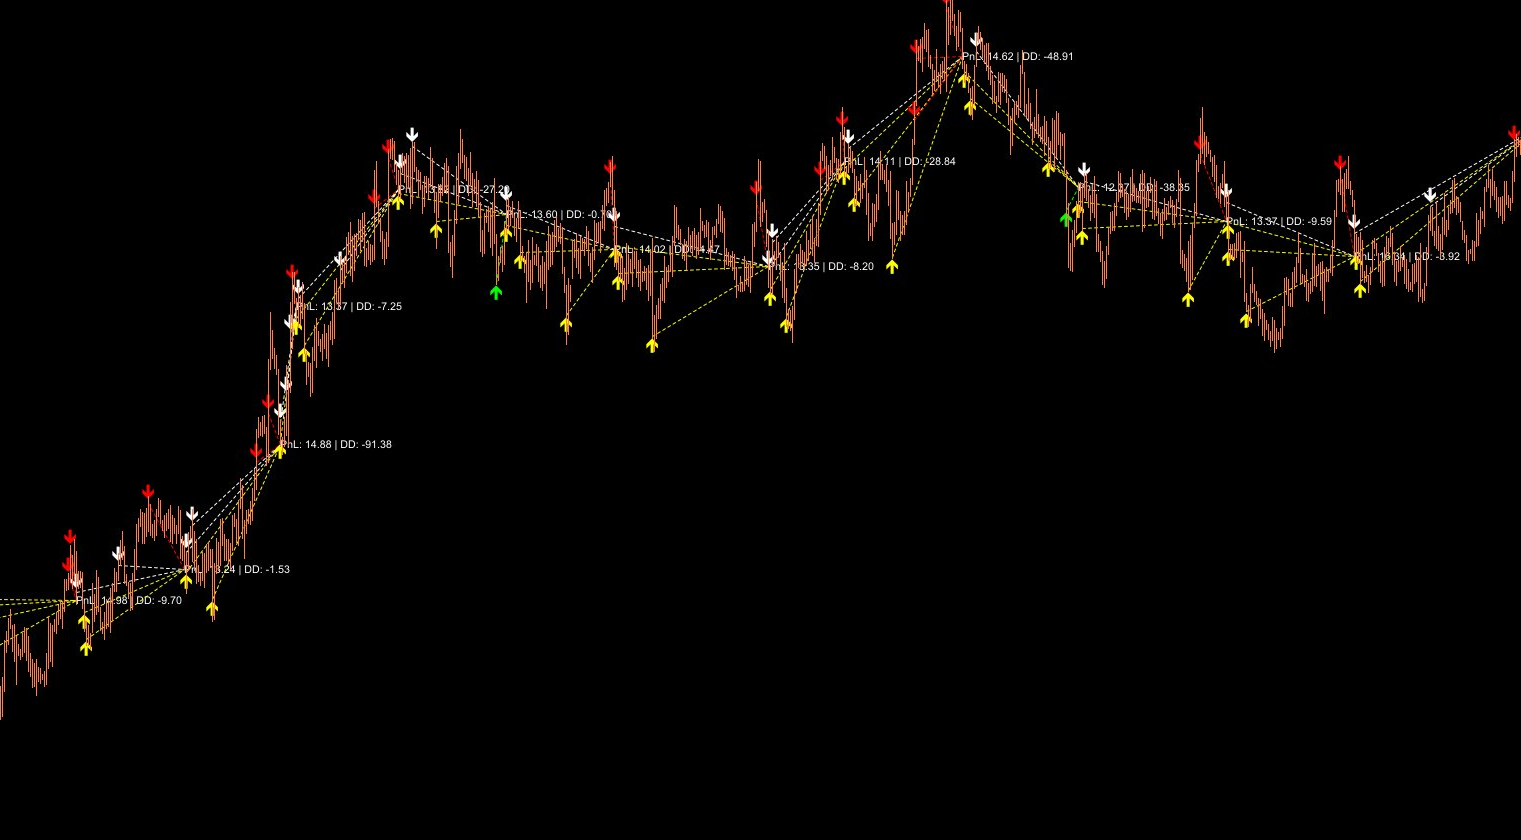
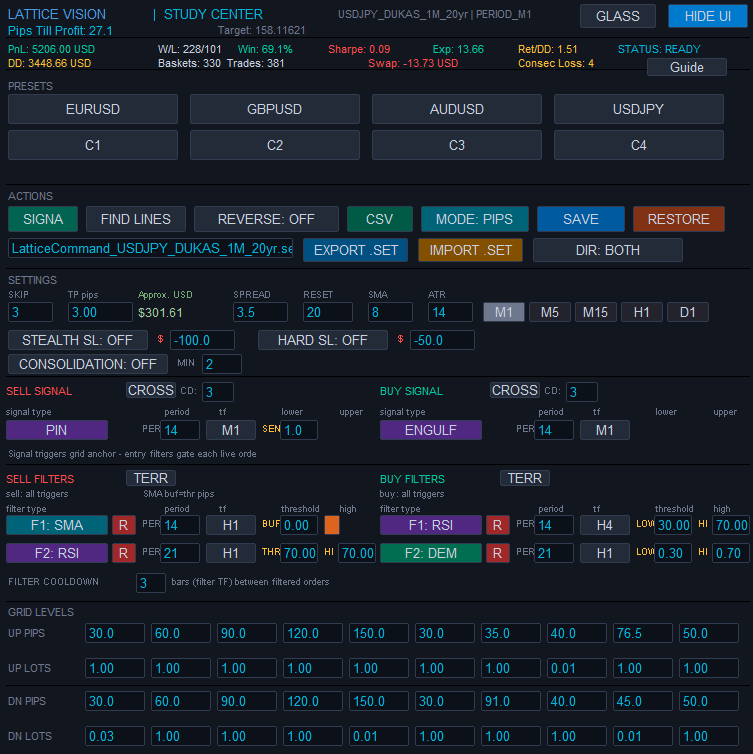
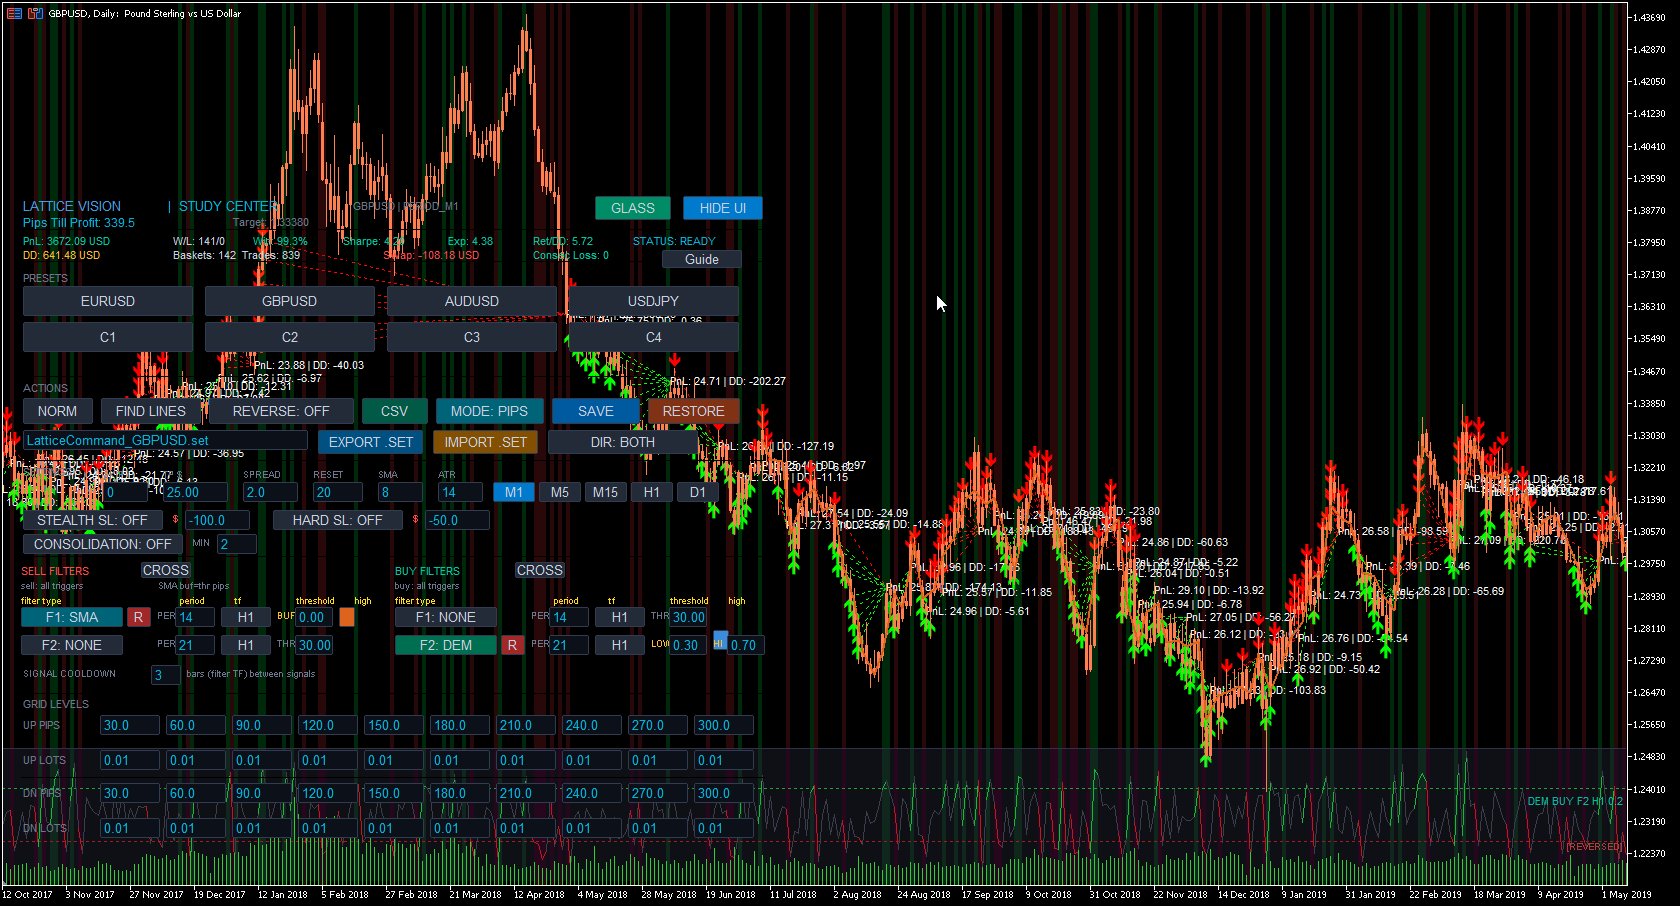
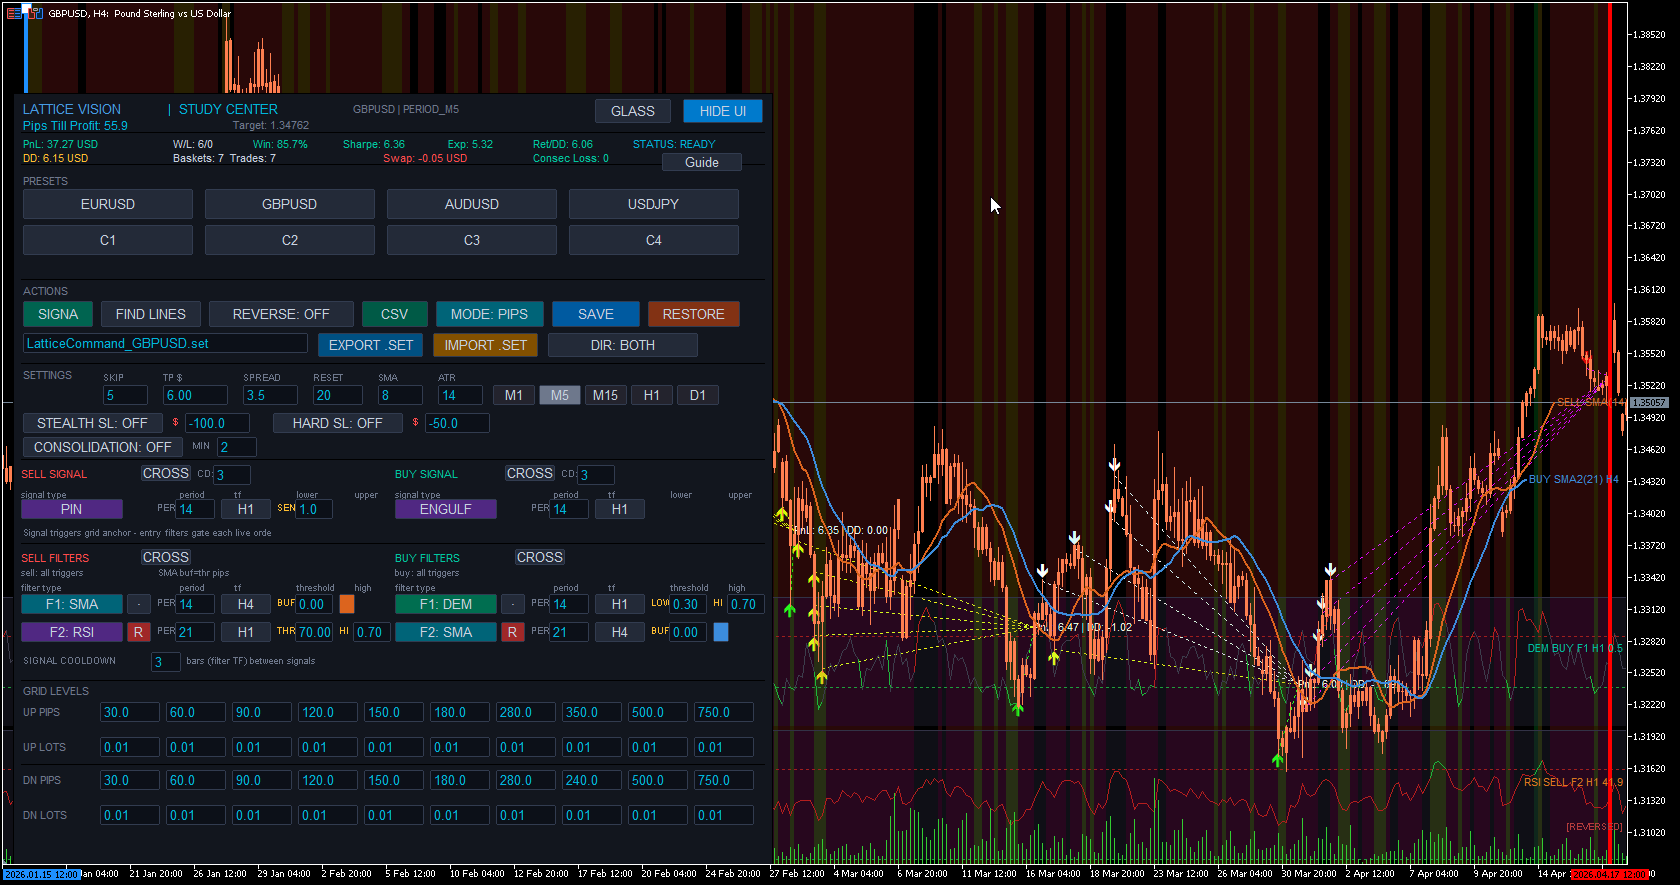
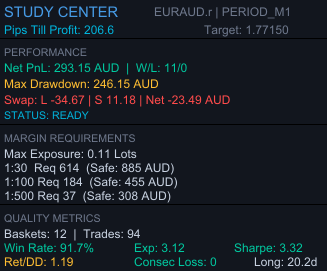
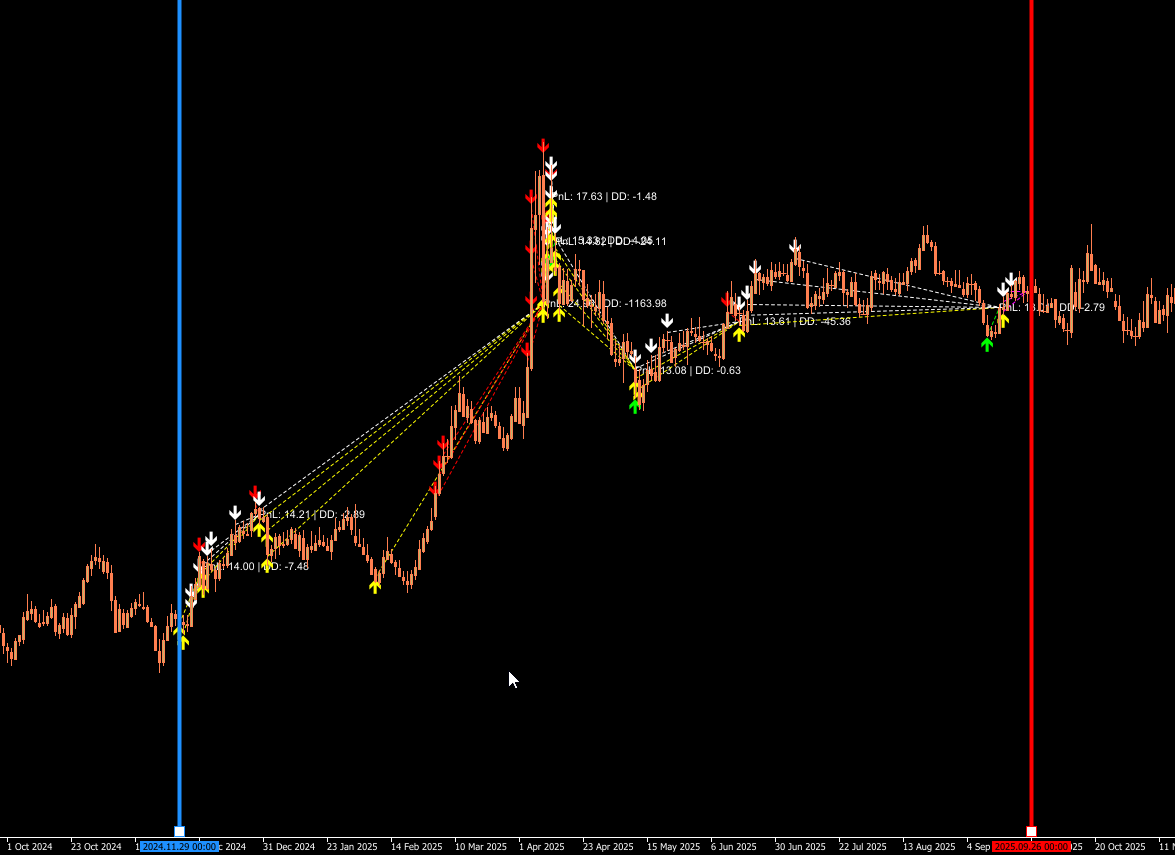
Lattice Vision™ is a visualisation and analysis tool. It does not place trades, generate trading signals, or execute orders of any kind. All results displayed are simulated, analytical, and visual in nature. The software provides no recommendations, predictions, or prescriptive guidance. It is a measurement and observation utility only.
Nothing in this product, its documentation, marketing materials, website content, or any associated communications from Cave and Fire Group Pty Ltd. or Cave & Fire Lab constitutes financial advice, a recommendation to trade, or a solicitation to buy or sell any financial instrument. We do not provide financial advice, trading signals, strategy recommendations, or investment guidance of any kind. All parameters, configurations, and any subsequent decisions based on analytical results are made entirely by the user. Users should seek independent professional financial advice before making any trading or investment decisions.
All use of Lattice Vision™ is entirely at the user's own risk. Analytical results produced by this software are based on historical data and user-defined parameters. Past performance — whether observed through this software or any other method — is not indicative of future results. No representation is being made that any configuration will or is likely to achieve profits or losses similar to those displayed. Trading financial instruments involves substantial risk of loss and is not suitable for all individuals.
Like all software, Lattice Vision™ may contain unforeseen bugs, errors, or limitations despite rigorous development and testing. Software is inherently complex and no developer can guarantee that every possible scenario has been anticipated or that the software will operate without error in all conditions. This product is intended for users who understand and accept the inherent limitations of software, including the possibility of unexpected behaviour or calculation errors. Analytical results do not account for execution variables such as latency, slippage, liquidity constraints, or broker-specific behaviour.
To the maximum extent permitted by applicable law, Cave and Fire Group Pty Ltd., its directors, employees, contractors, and affiliates shall not be liable for any direct, indirect, incidental, consequential, or special damages arising from the use of, or inability to use, this software. This includes but is not limited to financial losses, lost profits, trading losses, data loss, or business interruption, regardless of whether such damages were foreseeable or whether Cave and Fire Group Pty Ltd. was advised of the possibility of such damages.
By purchasing and using this software, users acknowledge that they have read and understood these notices and accept all risks described herein. Users are expected to: understand that analytical results are simulated and may not reflect real-world outcomes; independently validate all results before making any decisions; maintain appropriate risk management practices; ensure their use complies with all applicable laws and regulations in their jurisdiction; and seek independent professional financial advice where appropriate.
Lattice Vision™, Lattice Command™, Ghosting Technology™, and Cave & Fire Lab™ are trademarks of Cave and Fire Group Pty Ltd. MetaTrader 5 and MQL5 are trademarks of MetaQuotes Ltd. All other trademarks are the property of their respective owners.
The Execution Half
Discover it with Vision. Backtest and deploy it with Command.